|
Katie Davison of Northwestern Illinois University Center for
Governmental Studies (CGS) served as the moderator for the event.
After introductions around the room, Davison explained the end goal
for the session, then went immediately into relaying information
from studies the CGS had done prior to the session.
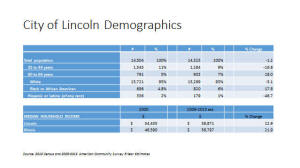
Using a power point presentation, Davison pointed out how the
population of the city is changing. The population in Lincoln is
14,323, down from previous census information. The biggest drop in
population is in the 35 to 44-year-old bracket by 16 percent. The
largest increase in population is in the 60 to 64 age bracket by 18
percent.

The median income per household is $38,871 compared to Illinois on
the whole with a median income per household of $56,797.
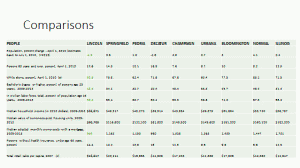
Comparing Lincoln to surrounding cities, Davison showed that with
the exception of Decatur, surrounding communities are growing
slightly. She also pointed out that at 92.9 percent, the city of
Lincoln carries the highest percentage of White only population, and
the very lowest percentage of residents with bachelor’s degrees with
the number being only 18.4 percent.
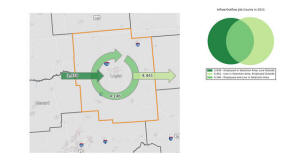
An interesting statistic Davison shared was commuter data. In the
slide she pointed out that there are 3,938 people coming into
Lincoln to work. They live in other areas, but commute to Lincoln
for their jobs. On the other side, there are 4,441 residents of
Lincoln who live here but leave the county for their jobs. At the
same time 4,146 live and work here.
Davison stopped her slideshow and Snyder picked up with a new one.
He said this was information he has presented to others in the past,
and he wanted to share it with the aldermen.
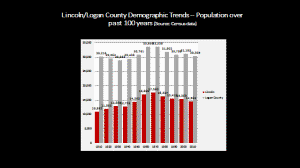
The first slide showed the change in population since 1910 in
Lincoln as well as Logan County. The population for both peaked in
the 1960’s and 1970’s. He noted that today, the population of
Lincoln is only slightly higher than it was in the 1950’s
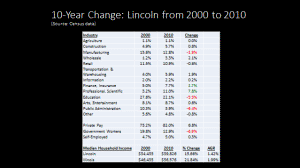
Comparing 2000 Census information to 2010, Snyder pointed out that
the community has lost workers in manufacturing, education, public
administration, and governmental jobs as well as retail.
The largest increase in jobs has been in the professional scientific
sector.
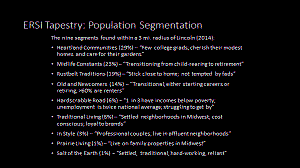
In the study of population, there are widely recognized terms that
define the types of people who live in a given community. Among
those terms, Heartland Communities, Midlife Constants, Rustbelt
Traditions, Old and Newcomers, Hardscrabble Road, Traditional
Living, In Style, Prairie Living, and Salt of the Earth.

Snyder pointed out that within a three-mile radius of Lincoln, the
majority of the population falls into the first three categories.
Heartland Communities is defined as “few college graduates, they
cherish their homes and care for their gardens.” Lincoln comes in
with 29 percent of its population in this category.
Midlife Constants are those transitioning from their child rearing
years to retirement and Snyder said that constitutes 23 percent of
our population.
Rustbelt Tradition, at 19 percent are the local residents who stick
close to home and are not tempted by fads.
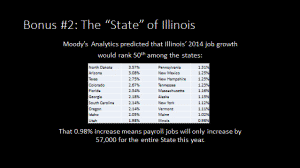
Looking at job growth on a national level, Snyder showed that
Moody’s Analytics work ranks the state of Illinois 50th for job
growth.
When Snyder had finished his presentation, Davison moved into
looking at the results of the survey recently conducted by the city
of Lincoln.
The survey was embedded on the city website in January, and LDN
provided links to it in its daily editions. During the survey
period, 755 people completed the questionnaire and submitted it
through the city website.
This figure represents about 5 percent of the population. On
Saturday, Davison would explain that in general it is only one
percent of the population that is actively engaged. Therefore the
755 figure was impressive.
In the survey, not all questions were answered. The question
answered most often with a 98 percent response asked how often
residents visited the city website.

The question answered least often was “What is the nearest
intersection to where you live” with only 44 percent responding.
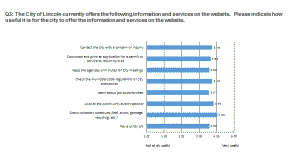
The survey did indicate that those who visited the website found it
to be useful for a variety of topics including contact information,
permit application downloads, finding council agendas and meeting
minutes, and checking collection schedules for leaf, brush, garbage
and recycling.
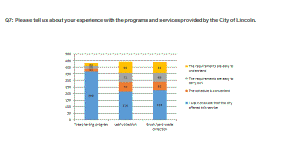
The survey showed that of the 755 surveys, many were unaware of
services offered by the city.
[to top of second column] |

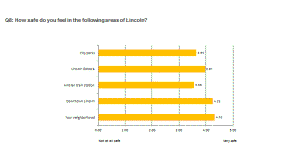
In the public safety category, the survey takers indicated they feel
safe in the city of Lincoln, especially in their own neighborhoods,
and also in downtown Lincoln.
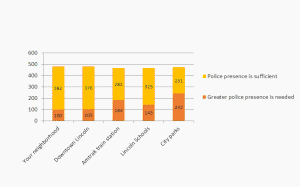
It was noted, that there is a need for a greater police presence at
the Amtrak station and in the city parks.
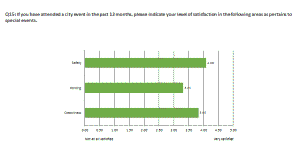

The city also ranked high in the safety category at public events
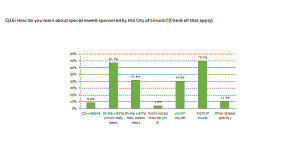
A question about how the citizenry learns about events in Lincoln
showed that residents are becoming more dependent on internet
services. While the highest percentage, 70.4, said they learned
about city events by word of mouth, the next two highest percentages
were given to the two internet based newspapers in Lincoln. Survey
takers also indicated that at 4.6 percent, the least used public
information product is the Public Access Channel 5 offered (at
survey time) through Comcast Cable.
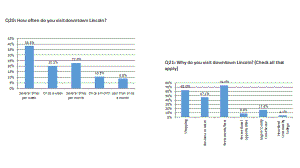
Answering questions about the heart of the city, survey takers
responded that 38.3 percent visit downtown Lincoln several times a
week. The survey also indicated that 63 percent of the people who do
visit downtown go there to shop.

Davison said this was a surprising, in a good way, result. She had
imagined that with the courthouse being included in the survey, it
would be the most visited.
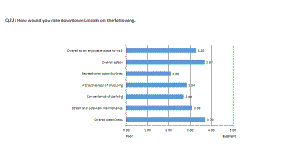
In some key areas, Lincoln on the whole, only ranked as middle of
the road, earning neither a poor nor an excellent rating. Included
in those key questions: Is the town an enjoyable place to visit and
overall is the city clean? Ranking low on the scale was convenience
of parking and recreational opportunities.
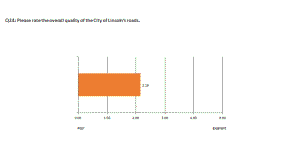
The survey also indicated that the condition of the roads in Lincoln
is a large concern for residents. This is information that the city
is well aware of, and has worked to create solutions on a long-term
basis.
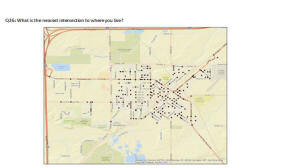
Davison also shared a slide that indicated where in the city the
survey takers had taken the survey. She noted that the dots
indicated computer IP addresses, and that she was pleased to see
that the survey had been taken from throughout the city, not just a
few specific regions.
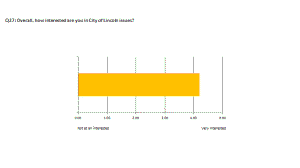
Another telling question was: How interested are you in city of
Lincoln issues? The survey indicated the residents of Lincoln are
‘interested’ to ‘very interested’ in the city.

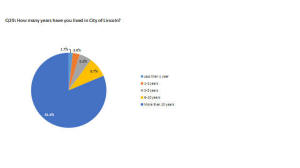
The survey indicated that 81.4 percent of those answering the
questions had lived in Lincoln more than 10 years. Other
demographics from the survey included employment. Sixty-two percent
said they were employed, 9.4 percent said they were self-employed,
17.7 percent were retired, and only 1.9 percent of the survey takers
were unemployed. In addition, 75.1 percent of the survey takers live
in the city of Lincoln. Of the survey takers 44.4 percent were male
and 55.3 percent were female.
As Davison wrapped up the presentation, she set the stage for what
would come on Saturday.
As the aldermen left for the evening, she wanted to give them four
questions to ponder.
“Who are the City’s stakeholders?”
“If you were to leave Lincoln and not return for 10 years, what
would you like to have changed? What would you like to stay the
same?”
“What makes you proud of Lincoln?”
“What concerns you most about the future of Lincoln?
On Tuesday, LDN will begin a series of articles about the Strategic
Plan process, including discussions by aldermen, accounts of
break-out sessions, results of the SWOT (Strengths, Weaknesses,
Opportunities and Threats) exercise, and much more.
Click here for slides from Davison's
demographic study
Click here for the full slideshow
presentation by Mayor Keith Snyder
Click here for the full slideshow
presentation of the city of Lincoln Survey results
[Nila Smith]
 |