|
 Agriculture is identified as contributing 80
percent of the Nitrogen and Nitrates (N) and 48 percent of the
Phosphorous (P) contaminating streams through runoff and leached
nutrients to tile drainage, as well as contributing to soil loss by
erosion, all of which have led to hypoxia in the Gulf of Mexico. Agriculture is identified as contributing 80
percent of the Nitrogen and Nitrates (N) and 48 percent of the
Phosphorous (P) contaminating streams through runoff and leached
nutrients to tile drainage, as well as contributing to soil loss by
erosion, all of which have led to hypoxia in the Gulf of Mexico.

The new Illinois Nutrient Loss Reduction Strategy may seem like
another government impingement on the farmer, and it is really. But,
working with ag industry leaders and a host of other experts, the
program targets graduated measures by voluntary compliance aiming
for 45 percent reduction of both N and P by 2050, with a 2025 early
assessment.
These goals may seem lofty and a burden, but consider that farmers
are already striving to be good land stewards while making a profit,
and as it appears from recent field research, both goals are
compatible, particularly in the use of N.

No one goes to the gas station and over fills their tank time and
again. That would be wasteful, costly, and environmentally unsound.
Everyone knows, corn eats nitrogen, more than any other grain crop;
both the plant while it is in growth stage and the grain while in
development. The nitrogen to yield ratio on established fields shows
adding more N gets higher yields.
But when is adding N eating profit potentials?
Nitrogen rates for corn
A bushel of corn contains about 0.8 pounds of N.
A 200-bushel corn crop removes about 160 pounds N from the field.
About two-thirds of the N in a corn plant ends up in the grain.
A 200-bushel crop would have about 240 pounds of N in the plants
before harvest.
This is 1.2 pounds N per bushel, the factor used to convert proven
or expected yield into N rate recommendations.
- “1.2 is the most [we] should do.” -

While soil type and condition, which influences the
availability of N, are steady factors in a given field; there will
always be a bit of a gamble as the weather - rains and temperatures
- play a big factor in how much N is available when a plant needs it
most.


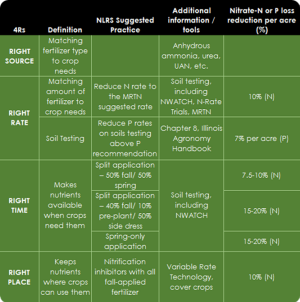
Year 1 - University of Illinois 2014 N-Watch field trials conclude:
- Getting the “right” N rate, timing, form, and
placement is possible, but the end result is and will remain
inexact – The list of N practices that belong on (or can’t yet
be taken off) the 4R list might be longer than we might think
- We can’t assume loss of early applied N, (but should be
ready to respond after loss)
- We can’t assume an advantage to late applied N
- Common sense says: start with the MRTN rate and build a
“safe” N system – one without big dangers of deficiency or loss.
The newest field tests and data studies now focus on when yields
are maximized to the cost of applied N (MRTN).

[to top of second column] |


In short-short summary: split fall/spring applications, additives to
fall N that prevent microbial action over the winter, and timeliness
to plant development are all showing stronger leads to higher yields
with less amount N and higher profits.

Optimal N rate-yield points are calculated based on the N price ($
per lb N) to corn price ($ per bushel) ratio of 0.1. An added note
from Managing Nitrogen, Illinois Agronomy Handbook, "...modern
hybrids may be better both at extracting N from the soil and at
using this N efficiently to produce grain. The latter is true in
part because the grain protein content of newer hybrids tends to be
lower than that of older hybrids, so the removal of N with the grain
is lower on a per-bushel basis.
 Now the big question you must answer for yourself, "Do you want the
bragging rights of the highest yield or the most profit when it
comes to applying nitrogen?
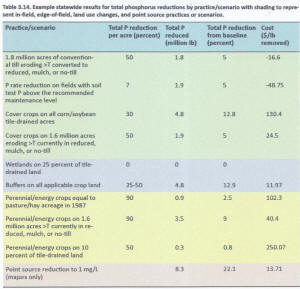
You may have noted nothing has been said here concerning phosphorous
control. While, yes, over application would lead to further losses
of P that would cost you to replenish and add contaminant to
waterways. However, most phosphorous could be controlled by
adoptions proposed for nitrogen management that include reduced
tillage and other conservation methods that build soils; healthy
soils with built up organic matter hold phosphorous well.
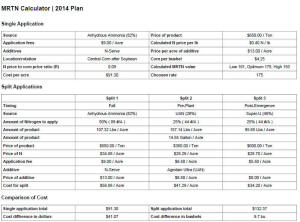
Nitrogen-use calculators can help you to estimate the best your
yield with maximum return to nitrogen (MRTN) with more accuracy.
This on-line map (zoom in and click on your
location) sets up a free calculator where you just enter your data. https://mygeohub.org/groups
/u2u/splitn
A downloadable Android app from UoI that is
free also:
https://web.extension.illinois.edu/
registration/?RegistrationID=7104
Charts and data
illustrations:
USDA Natural Resources Conservation Service
nrcs.usda.gov/Internet/NRCS_RCA/reports/
cp_il.html#ncpd
Illinois Fertilizer & Chemical Association Home - the 4-Rs
www.ifca.com/
Illinois Council on Best Management Practices
http://illinoiscbmp.org
University of Illinois, Crop Sciences handbook
Ch 9 Managing Nitrogen
http://extension.cropsciences.illinois.edu/handbook/
pdfs/chapter09.pdf
Illinois Environmental Protection Agency
http://www.epa.illinois.gov/
References and resources:
Illinois EPA, Illinois Department of Agriculture, Illinois Water
Resources Center, Illinois-Indiana Sea Grant, University of Illinois
Extension, University of Illinois at Urbana-Champaign: Dept. of
Natural Resources & Environmental Sciences, Dept. of Agricultural
and Consumer Economics, Dept. of Crop Sciences; Illinois Council on
Best Management Practices, USDA-Natural Resources Conservation
Service, Prairie Rivers Network, Illinois Pork Producers
Association, Environmental Law and Policy Center, Illinois Farm
Bureau, Association of Illinois Soil and Water Conservation
Districts, Sierra Club, Illinois Corn Growers Association
|