Analysis-As U.S. stocks rip higher, investors hunt for signs of market
bottom
 Send a link to a friend
 [October 19, 2022] By
Lewis Krauskopf [October 19, 2022] By
Lewis Krauskopf
NEW YORK (Reuters) - Some gauges of the
stock market's health are showing that the latest rally in U.S. equities
may be the start of a sustained move higher, though many investors are
hesitant to jump on board until there are signs inflation is cooling.
Few can blame them for being skeptical. The current gain – which has
seen the S&P 500 bounce about 6.5% last week's fresh intraday low for
2022 – comes on the heels of several rebounds throughout the year that
eventually crumbled. Meanwhile, markets have been gripped by stomach
churning volatility lately that has wrongfooted bulls and bears alike.
If anything, the macroeconomic picture has only grown more dire, as
stronger-than-expected U.S. inflation ratchets up expectations for Fed
hawkishness and recession fears grow, fueling investor reluctance to
participate in the recent upswing.
Still, there have been glimmers of hope. Some gauges that flashed
warnings throughout the year ahead are more positive, while the S&P
500's recent pattern of big upside moves echoes those seen in prior
market bottoms. Some standout U.S. earnings reports and ebbing worries
around systemic risk around Britain's budget woes have also underpinned
the rally.
“There are some signs of a bottom," said Ed Clissold, chief U.S.
strategist at Ned Davis Research. "In terms of whether or not it is the
bottom, there is still more to prove for the market.”
Improving market breadth, which shows whether a significant amount of
stocks are moving in unison, is one signal that has heartened investors.

Just 34% of stocks hit new 52-week lows last week along with the S&P
500's low, according to Todd Sohn, technical strategist at Strategas,
compared to 43% when the index made its low on June 16.
At the same time, measures of investor sentiment - including a monthly
fund manager survey by Bank of America Global Research - show the
highest pessimism in years, a contrarian indicator that has been a
bullish signal for stocks historically.
The crowd sentiment poll compiled by Ned Davis Research, a composite
indicator that includes investor surveys, option data and asset
analysis, recently fell to a level that had coincided with stock
reversals in March 2020 and 2011.
“If we can get some better news on the economic/inflation/Fed front
there could be a pretty powerful rally," Clissold said.
Mark Hackett, chief of investment research at Nationwide, points to the
S&P 500 posting five days of gains of about 2% or more in the past month
through Monday, noting a similar pattern occurred ahead of bottoms in
2020 and 2009.
[to top of second column] |
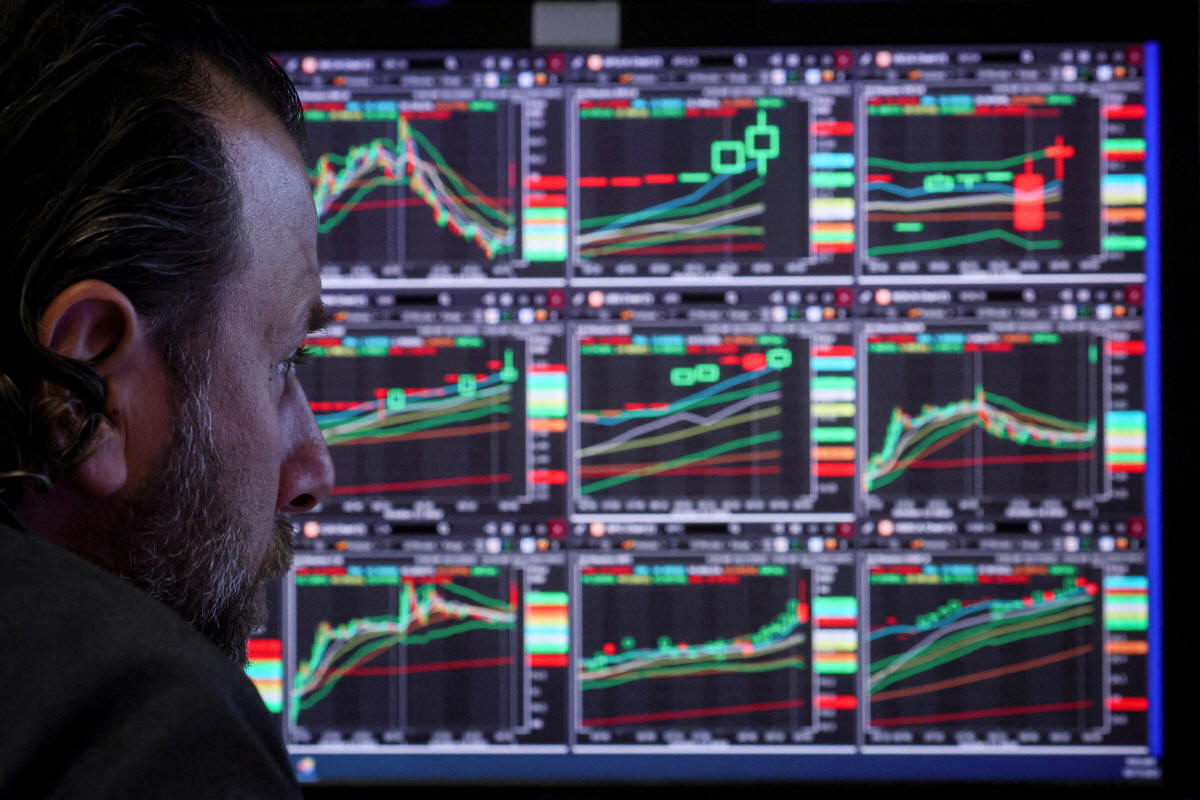
A specialist trader works on the floor
of the New York Stock Exchange (NYSE) in New York City, U.S.,
October 17, 2022. REUTERS/Brendan McDermid/File Photo

Widespread investor pessimism, improved valuations and a seasonally
strong period for stocks are among factors leading Hackett to
conclude that "we are awfully close to the bottom assuming we don't
have some sort of massive deterioration from here.”
Morgan Stanley strategist Michael Wilson, who has been bearish on
stocks throughout the year, this week said a "tradable tactical
rally looks likely," with S&P 500 rising to as high as 4,000 "as
good a guess as any." The index closed at 3,719.98 on Tuesday.
Not all indicators are telling a bullish story, including the
comparatively contained Cboe Volatility Index, known as Wall
Street's fear gauge. Reversals in stocks since 1990 have come after
the index hits an average of 37, which has signaled a bout of
fearful selling that then paves the way for bullish investors to
take the market higher.
However, the index has not been above that level since March even as
the S&P 500 continued making new lows. It was last around 30.
“What’s happening is the VIX is in this high but not super-high
range and you never get that complete 'pukage' in the markets,” said
Michael Purves, chief executive of Tallbacken Capital.
Sohn, of Strategas, is also eyeing the balance between puts, which
are typically bought for downside protection, and calls. The
put/call ratio is yet to approach a 10-day average of at least 1.2
that has historically indicated that "you are more in the ballpark
of panic and fear and close to a market low," he said.
The current bear market has also been less severe than many past
downturns. The S&P 500 slid as much as 25.4% this year, while bear
markets since 1929 have seen an average decline of 35%, according to
BofA.
Markets have bottomed when "investors have begun to contemplate
materially looser monetary policy over the next six to 12 months,
when a trough for economic activity is in sight, or when valuations
already fully reflect a credible 'bear case' scenario," analysts at
UBS Global Wealth Management wrote on Monday.

"Today, we do not believe these conditions have been fulfilled."
(Reporting by Lewis Krauskopf; Additional reporting by Saqib Iqbal
Ahmed; Editing by Ira Iosebashvili and Josie Kao)
[© 2022 Thomson Reuters. All rights
reserved.]
This material may not be published,
broadcast, rewritten or redistributed.
Thompson Reuters is solely responsible for this content. |