|
Features,
Honors
& Awards, Ag
Announcements
Calendar,
Ag News Elsewhere
(fresh daily from the Web)
|
|
Features
|
|
Aflatoxin guidelines
for livestock producers
[SEPT.
28, 2002]
URBANA — Some parts of
Illinois are reporting moldy corn after a growing season marked by
heat and stress. Livestock producers need to exercise caution if
they are feeding corn possibly tainted by mold, said Michael Hutjens,
University of Illinois Extension dairy specialist.
|
|
"Illinois toxicologists report that the
moldy corn samples they are seeing appear to be Fumonsin and
recommended that producers have tests conducted for aflatoxins, DON,
zearlenone and fumonsins in representative samples of corn," he
said. "The cost is $65 per sample to screen for four mycotoxins,
while Fumonsin alone is $30."
Mycotoxin and Fumonsin contamination of
corn fed to livestock can cause a number of problems. To avoid
these, livestock producers should have grain tested before feeding
and, if grain is found to be contaminated, strictly follow U.S. Food
and Drug Administration guidelines for its use.
"Producers also need to remember that
proper handling of damaged corn is critical, as additional growth
and mycotoxin occurs if moisture, oxygen and warm temperatures exist
during storage and handling of the damaged feed," said Hutjens.
Based on FDA guidelines, Gavin Meerdink,
U of I Extension beef and feed safety veterinarian, recommends the
following levels in feed: no more than 300 parts per billion (ppb)
in corn fed to finishing beef cattle; 200 ppb for finishing (over
100 pounds) swine; 100 ppb for breeding beef cattle, breeding swine
and mature poultry; and 20 ppb for other animal feeds.

[to top of second column in
this article]
|

"Based on recommendations of U of I
Extension veterinarians, dairy cattle diets should not contain more
than 20 ppb in the total ration dry matter," said Hutjens. "This is
not because of a health threat to the lactating cow; rather it is
related to milk residues."
Hutjens said the aflatoxin is
metabolized by the dairy cow and some can be excreted in the milk.
Milk must be under the 0.5 ppb level, the maximum allowed by the
FDA.
"In addition to losses from tainted
milk, dairy producers also can see decreased feed intake by their
cows, reduced rumen VFA production, increased liver damage, lowered
reproductive efficiency and less milk yield," said Hutjens.
"All
livestock producers need to be aware of these potential problems and
exercise care in feed use of mold-damaged corn."
[U of I news release] |
|
 |
|
|
New Web
tool can map and
analyze any part of Illinois
[SEPT. 27, 2002]
URBANA — Everyone, from
farmers and natural resource experts to city planners and real
estate agents, has an innovative new Web tool at their fingertips,
thanks to the combined efforts of the University of Illinois, the
Illinois Department of Natural Resources and other agencies.
|
|
The tool is the Resource Management
Mapping Service, the RMMS, a new website that allows people to
create maps of any area within Illinois in a matter of minutes.
"The uses for the RMMS website are as
varied as the users," said Rick Farnsworth, natural resources
economist with University of Illinois Extension. "State staff uses
RMMS to track changes in natural resources and adapt management
plans accordingly. And farmers visit the site to get a bird’s-eye
view of production or calculate acreage needed for state and federal
conservation programs."
"A long-distance runner once used the
website to measure and map a marathon route," Farnsworth added. "In
addition, real estate agents have used it to show prospective
clients the area in which they hope to buy property."
"City planners also benefit," he said.
"If a town wants to expand, they need information about the impact
this growth will have. For instance, where will this growth occur in
relation to the town’s existing boundaries? Will growth encroach on
the state’s mandated buffer around public wells or protected
habitat? They can start making decisions using the maps they create
on this website."
"One of the key strengths of RMMS is
that we have most of the data that is publicly available from state
and federal agencies," Farnsworth noted. "Users can come to one
site, locate the area of interest to them and create the maps they
need."
Users can search by county, watershed,
town or ZIP code, or they can draw rectangles on the map to zoom to
an area they want to view, he said. Once there, they can choose a
base layer on which to lay all other data layers. There are more
than a dozen base layers, including cropland maps from 1998, 1999
and 2000 or aerial photographs taken in 1998 and 1999 that allow you
to see the land in question.
After a base layer has been chosen, any
number of other layers can be added. These include:
• Resource layers, which
identify county land, lakes, rivers, watersheds, wetlands and other
natural resource features.
• Administrative layers,
which include various Department of Natural Resources districts, as
well as townships, congressional and legislative districts.
• Economic layers, such as
state highways, county roads, wells and more.
[to top of second column in
this article] |
After choosing the layers you wish to
see, simply hit the refresh button. One note of caution: Zoom in to
the area you want to map before overlaying data. Most of the data
sets are very large and take time to load. The smaller the area you
choose, the less time you will spend waiting to view your map.
When users are finished, they can
create their own log-in name and password, then load and save their
map for future reference. Maps can also be printed or e-mailed to
work associates, state agencies, family or friends.
According to Farnsworth, the next step
for the RMMS site is to create decision tools based on the
information available.
"During the first two years, our job
was to collect data and make it available over the Web," he said.
"Now we’re developing tools that will help agencies and the public
assess the impacts of land use change on the state’s natural
resources. Our partnership with IDNR and the other agencies is
focusing university research on the state’s resource problems and
providing the means in which it can be used shortly after it becomes
available."
The Wetland Impact Review Tool, or
WIRT, is the first of several such tools that will come online in
2003.
"When someone wants to change land
use," said Farnsworth, "WIRT will alert the user to likely resource
problems. Click on the WIRT tool, zoom in to the land in question
and draw a line around it. Everything else is automatic. WIRT will
give you a head’s-up on the presence of nearby wetlands, nature
preserves, streams and flood zones, to name a few."
The RMMS website is funded by the
Illinois Department of Natural Resources and the Illinois Council on
Food and Agricultural Research, C-FAR. Farnsworth believes it is a
noteworthy success story of cooperation that started with C-FAR
members setting a high priority on better resource management of the
state’s natural resources.
"C-FAR provided funds to collect data
and build new partnerships between the university and the state of
Illinois," said Farnsworth. "The end result will be a
state-of-the-art system that IDNR and the public can use to protect
the state’s soil, water, plant and animal resources."
The RMMS
website is located at
http://space1.itcs.uiuc.edu/website/rmms.
[University
of Illinois press
release] |
|
|
Manure
application goes high-tech
[SEPT.
26, 2002]
URBANA — The
pick-a-gear-and-go method of manure application could soon be a
thing of the past.
|
|
Ted Funk, University
of Illinois agricultural engineer, is developing a high-tech,
low-cost slurry applicator that will supply a predetermined,
constant flow of manure that can be varied to provide a more precise
application.
Traditionally,
farmers have judged their rate of manure application by the speed of
their tractor. Go slow and the application is heavy. Speed up and
the application is light. Without the equipment necessary to measure
application rates, farmers cannot accurately judge the amount of
manure going onto their fields.
But ongoing concerns
over pollution risks from field runoff have resulted in stricter
government regulations, which are holding producers increasingly
accountable for their manure management practices.
So Funk has adapted a
pneumatic pinch valve to control slurry flow rates. The pinch valve
is connected to a computer and adjusts automatically to changes in
air pressure.
"We can measure the
pressure differences in the liquid streams, and by that we can
predict what the flow rates are," said Funk.
The valve, 6 inches
in diameter to match the discharge pipes of most tanks, is also
designed to prevent clogs in the system.
"It’s a wonderful
valve, because you can’t clog it," said Funk. "If it starts to
clog, you just release valve pressure and it opens up."
A radar gun on the
tractor senses how fast the equipment is going, and that information
is fed into the computer. Then the flow rate to the valve adjusts
accordingly.
"If we set our
application rate at 5,000 gallons per acre, it will measure the
field speed and keep it at 5,000 gallons, no matter how fast or how
slow you drive," said Funk.
[to top of second column in
this article]
|
The next level of
development will incorporate the use of Global Positioning System
technology.
"A GPS unit can sense
when farmers are getting close to a stream or a well, someplace
where they can’t legally apply manure," said Funk. "That information
will shut the applicator off automatically."
More advanced GPS
technology will use maps that already have calculations done based
on field soil tests.
"How much manure
should go to various parts of the field, based on the fertility of
the field?" asked Funk. "Applying manure based on what the crop is
going to need — that’s the gold standard."
Systems currently
marketed that can control the rate of slurry applications cost as
much as $30,000. Funk hopes to provide this technology at a more
reasonable price for the small producer.
"Most farmers already
have a slurry tank," Funk said. "We’re trying to develop a system
for that farmer. We want to be able to tell him, ‘Here’s what you
buy. Here’s how you put it together.’" Parts for the system should
be on the order of $5,000.
Funk hopes to have
the system up and running within a year. "We’re still working on
getting some bugs out of the main hardware, but I think we have a
good picture on how we control the system itself."
Top Air of Cincinnati, Ohio, has loaned
the project a slurry tank and soil injection equipment. The research
is funded by the Illinois Council on Food and Agricultural Research.
[U of I news release]
|
|
|
Use of
ethanol byproducts as feed
[SEPT.
25, 2002]
URBANA — The rapid growth of
the ethanol industry in the Midwest has had a spinoff benefit for
the Illinois livestock industry — an increased quantity of potential
feed, according to University of Illinois Extension specialists.
Distillers’ grains are produced as byproducts of the fermentation of
grain into alcohol. The grains are fed wet or dried and sold as a
high-protein or energy grain feed.
|
|
"Historically, this product has not
been used in swine diets because of the low protein quality, low
amino acid digestibility, high fiber content and the nutrient
variability among the sources," said Gilbert Hollis, U of I
Extension swine specialist. "This left an image of an inferior
ingredient for swine diets."
However, recent University of Minnesota
research indicates that new ethanol plants are producing byproducts
with higher nutrient content and digestibility than that listed in
the 1998 National Research Council publication on swine nutrient
requirements.
"Distillers’ grain should be positioned
as a protein supplement in the rations of dairy cows," said Mike
Hutjens, U of I dairy specialist. "Five pounds of dried distillers’
grain (DDG) or 10 pounds of wet distillers’ grain (WDG) is a
‘conservative’ upper limit. These levels could provide one-half of
the supplemental protein, with the remaining half from soybean
meal-based protein supplements."
According to Dan Faulkner, U of I
Extension beef specialist, DDG or WDG can be fed as up to 30 percent
of a beef cattle diet.
"Based on the energy content of
distillers’ grain for beef cattle, DDG’s break-even price was
reported at $94 a ton, and WDG with 45 percent dry matter was $47,"
he said.
For swine, Hollis said distillers’
grains have higher protein, fat and fiber content than corn due to
the fermentation process removing the starch component.
[to top of second column in
this article]
|
"Distillers’ byproducts do have several
features that limit use in swine diets," he noted. "The high fiber
content may cause diarrhea in young pigs. Distillers’ grains will
have a lower metabolizable energy content due to less starch. The
crude protein content is relatively high, but the amino acid profile
is not well-balanced."
Hollis added that swine diets
containing distillers’ dried grain with solubles need to be
formulated on a digestible lysine and energy basis. Formulating the
diet on a crude protein basis will result in a lysine deficiency and
possibly a deficiency of other amino acids, which will reduce growth
performance.
All three specialists noted there are a
number of guidelines livestock producers need to follow when using
distillers’ grains in feed.
Guidelines
are available on the Web at
http://il-traill.outreach.uiuc.edu/.
Click on the PorkNet icon and then on the "DDGS Feeding" topic.
Information about dairy and beef cattle feeding guidelines can also
be found at that site. Click on the DairyNet icon and then search
for "distillers." This will take users to a January report,
"Distillers Grain Opportunities" by Hutjens.
[U of I news release] |
|
|
Weekly outlook
Corn and soybean markets
[SEPT.
24, 2002]
URBANA — In spite of strong
market signals to the contrary, reports suggest that producers are
not rushing to sell corn at harvest time, said a University of
Illinois Extension marketing specialist.
|
|
"If the crop size forecast does
increase, higher prices will have to be generated by demand or
concerns about next year’s crop," said Darrel Good. "If consumption
unfolds as projected, it will be difficult for prices to move a lot
higher before next spring. With use as projected, higher prices in
the near term may require an unchanged or smaller crop forecast in
October."
Good’s comments came as he reviewed
recent action in the corn and soybean markets. December 2002 corn
futures established a contract high of $2.96 on Sept. 9. The USDA
reports released on Sept. 12 contained a smaller forecast of the
2002 U.S. corn crop (down 37 million bushels from the August
forecast), a smaller forecast of foreign coarse grain production and
a smaller forecast of U.S. and world grain inventories at the end of
the current marketing year. Since those smaller forecasts were
released, December corn futures have declined 31 cents.
"A number of factors may have
contributed to the decline, but liquidation of long positions held
by speculative traders has been one of the dominant factors
pressuring prices," said Good. "The liquidation appears to have been
triggered by reports of ‘better than expected’ yields.
"It is never clear whose expectations
have been exceeded, but the reports have resulted in ideas that the
USDA’s October production forecast may exceed the September
forecast, as was the case last year."
In addition to thoughts that the U.S.
crop could exceed the current projection, the slow start to the
2002-03 export program raises concerns about corn demand. As of
Sept. 12, the USDA reported 2002-03 marketing year export
commitments at 303 million bushels. That figure is about 8 percent
smaller than export commitments on the same date last year. The USDA
has projected that exports during the current marketing year will be
100 million bushels larger than exports of last year. Compared with
last year, smaller sales have been registered to Egypt, Taiwan,
South Korea and China. Prospects for a larger Chinese corn harvest
create concerns about Asian demand for U.S. corn.
"Recent price behavior in the corn
market is a reminder that U.S. and world feed grain supplies are
smaller than a year ago, but little, if any, rationing of use may be
required," said Good. "Current new crop price relationships are
slightly in favor of additional corn acreage in the United States in
2003."
[to top of second column in
this article]
|
November 2002 soybean futures reached a
high of $5.91 on Sept. 11. The USDA’s Sept. 12 reports contained
larger forecasts (compared with the August forecasts) of U.S. and
world soybean production and stocks for the 2002-03 marketing year.
Since the forecasts were released, November futures have declined
about 24 cents.
"While the forecasts suggest that use
of U.S. soybeans will have to decline during the current marketing
year, world supplies are expected to be adequate to allow for
increased consumption," Good noted. "The USDA currently projects a
3.3 percent increase in world soybean consumption. The increase is
expected to come primarily in South America and China.
"The South American increase reflects
expectations of a larger crush, primarily to meet export demand for
soybean meal. China is expected to import 36 percent more soybeans
than last year in order to expand the domestic crush to support
increases in domestic meal and oil consumption."
U.S. soybean exports during 2002-03 are
projected to be 215 million bushels (20 percent) less than exports
during the past marketing year. As of Sept. 12, the USDA reported
that export commitments for the current marketing year totaled 240
million bushels. Commitments are nearly 5 percent larger than on the
same date last year and account for slightly over 28 percent of the
USDA’s projection for the year.
New sales need to average only 12
million bushel per week for the next 50 weeks to reach the USDA’s
projected level of exports. At 62 million bushels, current
outstanding sales to China are nearly double the level of sales of a
year ago. On the other hand, sales to the European Union, the
largest buyer of U.S. soybeans, total only 19 million bushels. Sales
to the EU are down by two-thirds from sales of a year ago. The EU is
currently buying larger quantities of South American soybeans.
"Early season reports on U.S. soybean
yields have not been as numerous as corn yield reports," said Good.
"Early results apparently do not differ significantly from
expectations."
Soybean prices will be influenced by a
wide range of factors, including subsequent U.S. crop forecast, rate
of use and prospects for the South American crop.
"The most
important factor near term will be the USDA’s October production
forecast for the United States," said Good.
[U
of I news release]
|
|
|
FFA reporter attends
workshop
[SEPT.
24, 2002]
Brittney Kavanaugh from the
Hartsburg-Emden FFA attended the FFA Reporter’s Workshop at Lincoln
Land Community College in Springfield recently.
|
|
The workshop
was presented by Emilee Bocker, the state FFA reporter for Illinois.
"She did a great job," Brittney said, adding that it was "a great
learning experience for everyone who attended the workshop."
[FFA news release] |
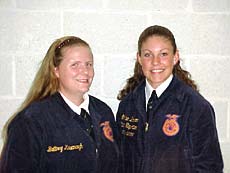
[Photo provided by FFA] |
|
|
Section 14 FFA members attend
leadership camp
[SEPT.
24, 2002]
The FFA Leadership Camp 2002
was a great success and a lot of fun for Hartsburg-Emden students
who attended.
|
|
Robin Niehaus gave a presentation on
"Get Fired Up," and the FFA alumni also gave a presentation. The
state officer team conducted mixers, and members were involved in a
talent show, quiz bowl team, volleyball team, challenge course,
"good morning" radio show and flag committee. Participants at the
camp learned more about community development, student development,
chapter development and much more.
Thanks to
those who support the FFA so that individuals can attend events like
this.
[Brittney Kavanaugh,
Hartsburg-Emden FFA reporter] |

[Photo provided by FFA]
[Pictured,
left to right, are
Jeff Evers, Brittney Kavanaugh, Ryan Fleck, Bruce Frank and Justin
Brown.] |
|
|
Harvest progress
[SEPT.
23, 2002]
As of today, the harvest
progress stands at about 15 percent completed for corn harvest and
virtually 0 percent for soybeans. Corn progress varies widely by
local area as farmers have been searching for dry corn to start in.
Many area cornfields have been "opened up," meaning that end rows
have been harvested.
|
|
Moisture percentages have ranged from
the upper 20s down to the upper teens. Due to the cost of drying,
most producers don’t want to start harvest unless moisture is in the
lower 20s, unless there are problems with corn standing upright.
Once again there are pockets of corn that are lying flat on the
ground due to windstorms, corn borer damage and stalk rots.

[Photos provided by John Fulton]
Preliminary results from the county
corn borer survey indicate heavy corn borer pressure, especially on
the east side of the county. The average survey found almost four
borers per plant on the east side of the county in 24 of 25 plants.
These numbers will give us over a 10 percent yield loss due to
European corn borer this year. This is in addition to fields that
may be prone to stalk breakage in windstorms. Another factor is
possible dropping of ears due to corn borers weakening the shank
that attaches ears to the stalk.

[to top of second column in
this article]
|
Early yield reports have been as
expected — highly variable. Many yields reported have not been from
entire fields but from combine yield monitors and weigh wagons. The
low-end yields have been just over 100 bushels on some corn after
corn, and the high yields have been over 200 bushels per acre in
areas that received timely rainfall.
Where will yield averages fall?
Somewhere between those two numbers. As yields reports have not come
from whole field averages, take them with a grain of salt.
Individual field variation has been greater than the yield reports.
In another month or so, we’ll have a good handle on what yields
were.

[John
Fulton]
|
|
|
Hartem observes National Farm Safety Week
[SEPT.
23, 2002] For National
Farm Safety Week the Hartsburg-Emden Intro to Ag class put up a
window display at the Hartsburg State Bank. [Photos provided
by ag class.]
|
|

|
 |
|
|
Honors
& Awards
|
|
|
Ag
Announcements
|
|

